Cocoa Tutorial: Fixing Memory Leaks With Instruments
![]() As I am getting toward what I think is the end of coding for an application I hope to release soon, the nitty gritty work of fixing leaks, optimizing code, and squashing bugs has become the majority of what I’m doing now. Gone is the fun part of the application development process where I was creating features and solving new problems. It is now drudgery and focusing requires diligence. I know that the rewards are worth it as these final steps are what give an application stability and make it shine, but getting through it can be nothing but toil. Fortunately with the developer tools that shipped with Leopard, Apple has made this work much easier to handle in a little application called Instruments.
As I am getting toward what I think is the end of coding for an application I hope to release soon, the nitty gritty work of fixing leaks, optimizing code, and squashing bugs has become the majority of what I’m doing now. Gone is the fun part of the application development process where I was creating features and solving new problems. It is now drudgery and focusing requires diligence. I know that the rewards are worth it as these final steps are what give an application stability and make it shine, but getting through it can be nothing but toil. Fortunately with the developer tools that shipped with Leopard, Apple has made this work much easier to handle in a little application called Instruments.
As usual, I’ve created a demo application that will allow you to see how things work. You can download it here: Leaky Demo Application. In this post I am simply going to show you how to use Instruments to detect memory leaks. It’s pretty straightforward, but there are few little nuances you may not be familiar with that once you understand will help you feel comfortable using this powerful tool.
Running Instruments From XCode
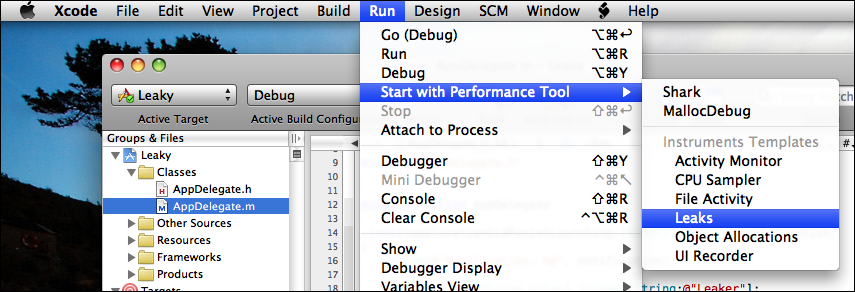
You can start Instruments directly and then navigate to your project build, however, it’s much quicker and simpler to start Instruments from XCdoe. To do so , open the demo project or a project of your own in XCode and select Run | Start With Performance Tool | Leaks.
While working on this project, Marcus and I discovered a few things that you should keep in mind while you are using Instruments.
- Breakpoints Do Not Break. Instruments utilizes debug information from your debug build, however, it does not stop at break points you set. This is because while you are loading your application into Instruments from the menu in XCode, Instruments simply uses the path of the current executable as its start path and loads it externally from XCode. The menu in XCode is really there as a convenience mechanism. This is not a big deal as you can always run again in Debug mode after your instruments session should you want your application to break. It’s just something to make a note of.
- NSLog Statements Do Not Show In The Debugger Console. If you want to see your NSLog statements, you will need to load the system Console application (/Applications/Utilities/Console).
Leaking Like A Sieve… Or Not
Our expectation was that when we allocated memory for a new NSString* object we would see it leak right away. This was, after all, our intention. Things, however, don’t always work the way you might expect. This code would not leak in our tests no matter what we tried.
NSString *string = [[NSString alloc] initWithString:@"Leaker"];
And here’s why. It turns out that since NSString(s) are immutable and since we are allocating the string using the @ operator, the compiler is making things more efficient for us. Strings with the same contents are given the same memory address. Here is a comment from the CocoaDev site that clarifies what I mean.
The nice thing about using the @”” notation for initializing NSString objects is that if you create two of them and their content is the same, the runtime uses the same storage for them. (Note, this is not guaranteed and certainly may not be the case across compilation unit or library boundaries. It is a performance optimization and the fact that it happens sometimes should not lead you to believe that you can safely, for example, use “==” to compare strings if you know they’re both from string constants.) (Ref. CocoaDev NSString)
In the example code, the NSString objects never leak and so they weren’t very useful. This isn’t to say that they never will leak, so you should be in the habit of calling release on your NSString(s), however, for our example project at least, the NSString leaks were never detected. We instead switched over to using NSMutableString at which point the application began to leak as desired.
Detecting Leaks
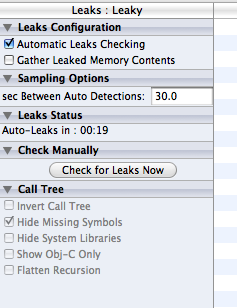
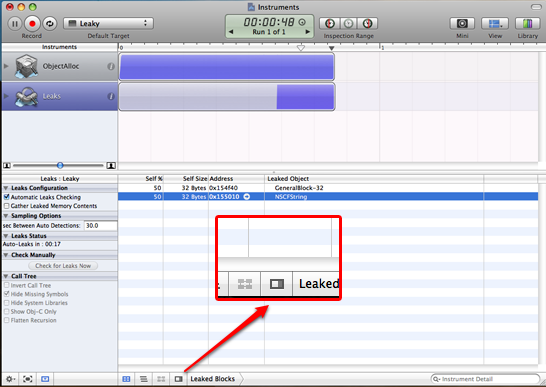
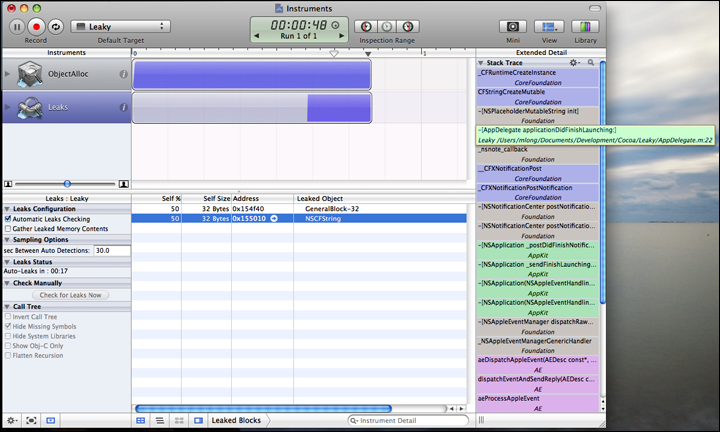
When instruments loads your application, you will see the ObjectAlloc track start to fill in. To detect the leaks in your project, click on the Leaks track and then watch the Leak Status category which will detect leaks after the current timeout value. Alternatively, you can just click the Check For Leaks Now button under the Check Manually category.
Once the leak detection process has occurred you will see a list of objects that are currently leaking. To get details for any leaks in the list, click the object in the list and then click the Extended Detail button at the bottom of the Instruments screen.
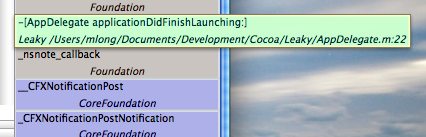
Once you have clicked the Extended Detail button, you will see the stack trace list on the right side of the Instruments window. Look through the stack and locate any code highlighted with the color #CCFFFF which looks like this.

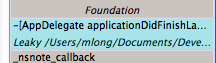
Note: This is actually inaccurate. The color may be different on your machine than on mine. Instead of looking for a color, look for your applications name and path and double-click that instead.
Thanks to Jason for pointing out the error.
Once you find the leak in your application, simply double click it and Instruments will return you to the exact line in XCode where the leak is happening.
To fix the leak, you need to make sure that you release the object. For more information and basic guidelines on memory allocation and deallocation, do a Google search. You can start with sites like this one: Very simple rules for memory management in Cocoa.
Conclusion
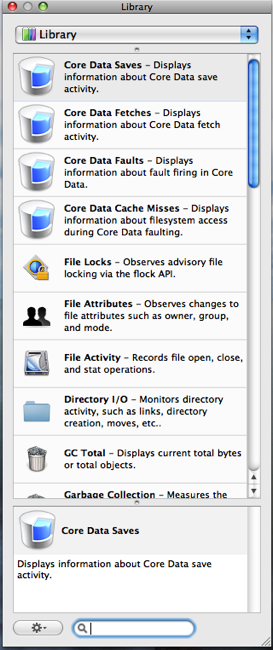
Finding and fixing issues is not the most glamorous aspect of application development, however, when done, the results are very rewarding. Instruments provides a streamlined way to track everything you would care about in your application. Watch this site for more tutorials on how to use other components available in Instruments. If you want to get an idea of what’s available, click on the Library button in Instruments and scroll through the ensuing list. It’s impressive.
No matter how many times I run your sample app through Instruments, I never get a double-clickable detail in the color #CCFFFF. The only details I see in that color are blocks with a memory address on them and when I click, they do nothing. The only details I can click on are a mauve color of some sort. I’m following your details to the letter. Any idea what might be wrong? And also, do you guys know of a reference to what each color represents?
Jason, the colors are used to make each library visually distinct. Ctrl+Click and choose Color By Library.
Regards
Jason,
Send me a screenshot at matt at cimgf dot com so I can take a look.
-Matt
Will do once I’m back at home with my Mac.
Thanks for the writeup..
I was unable to get instruments to detect the leak in the applicationDidFinishLaunching method. Am i doing something wrong or does it not pick it up.
Josh,
Does it detect them when you click the “Leak” button? Are you sure you’re waiting for it to timeout or clicking the “Check For Leaks Now” button? It doesn’t display leaks in real-time. It checks for new leaks every 30 seconds.
Hmm, I am not getting a leak either after letting the App run for 5 minutes and 41 seconds. This is with XCode 3.1 Beta 2 on Leopard.
Okay,well I know what part of my problem was. Not noticing that the test app had a leak button. You didn’t mention it in your article and given instruments starts on top I didn’t see it.
However the leak in applicationDidFinishLaunching is not recorded by Instruments.
I’ve also seen it miss the initial leak from applicationDidFinishLaunching, but I can’t reproduce it consistently. Sometimes it shows up, and sometimes it doesn’t. The times when it doesn’t may have occurred when I changed the default timeout to 1 second instead of 30, I’m not sure… more experimentation will follow.
Also, my colours are different too. Cyan blocks just show hex numbers (a library without debug info available?), while blocks matching the app appear green. Sorry, but being a heterosexual male, cyan/green is as much distinction as I can make between colours :)
[…] →cocoa tutorial […]
[…] you may be familiar with using tools like Instruments to find and fix memory leaks in your application, the Clang Static Analyzer takes a different approach to memory leak detection by compiling your […]
[…] Cocoa Is My Girlfriend » Cocoa Tutorial: Fixing Memory Leaks With Instruments Instruments User Guide: Memory […]
[…] Cocoa Tutorial: Fixing Memory Leaks With Instruments […]
Thanks for writing this outstanding blog guys. I have just one quick inquiry for this particular thread. After releasing the NSMutableString, there is still a leaked object showing up in the application for NSPathStore2. Is this typical to leak? Is it something within the SDK that’s having issues? (Running 2.2.1 here.) Here’s a screenshot: http://dl-client.getdropbox.com/u/57676/screenshots/leaks.png
Thank you for the information on Instruments. There is so little out there…
Anyway…. Can anyone tell me why this leaks?
– (void)applicationDidFinishLaunching:(UIApplication *)application {
[window makeKeyAndVisible];
NSString *file = [[NSBundle mainBundle]
pathForResource:@”paris” ofType:@”mp3″];
NSURL *fileURL = [[NSURL alloc] initFileURLWithPath: file];
AVAudioPlayer *newPlayer =
[[AVAudioPlayer alloc] initWithContentsOfURL:fileURL error:nil];
[fileURL release];
self.player = newPlayer;
[newPlayer release];
[self.player play];
}
– (void)dealloc {
[window release];
[super dealloc];
[player release];
}
Thanks for the blog entry! Instruments/leaks was confusing me until I stumbled across this!
However… I am also experiencing a memory leak using AVAudioPlayer. Thanks to Instruments/Leaks and this blog, every other memory leak in my program has been tracked down and quashed, but not this one. With this bit of code:
I get a memory leak on the prepareToPlay line. If I remove that line, then I don’t get a memory leak flagged until some time later, when I call [ self.backgroundMusic play].
I use AVAudioPlayer elsewhere to play non-MP3 using basically exactly the same code, with no memory leaks.
Any ideas?
Thanks,
Dingo
[…] http://www.cimgf.com/2008/04/02/cocoa-tutorial-fixing-memory-leaks-with-instruments/ Possibly related posts: (automatically generated)IPhone development on Windows machineMore Dev-friendly Tools for iPhone Emerge Pointing to Apple’s Achilles’…iPhone Memory ManagementMemory Leaks and iPhone App Development […]
[…] http://www.cimgf.com/2008/04/02/cocoa-tutorial-fixing-memory-leaks-with-instruments/ IPhone none […]
[…] And here is a nice tutorial for using instruments to debug Comments (0) « Custom XCode Logger […]
[…] Cocoa is my Girlfriend […]