Xcode LLDB Tutorial
What inspired the Xcode LLDB Tutorial? Well, I tweeted this the other day:
A few people then responded over twitter asking that I would elaborate by writing a tutorial here on CIMGF. So here it is. Your wish is my command, The Xcode LLDB Tutorial
Apparent Debugger Design Goals
If you have ever done debugging without a debugger, then you know how great a debugger is–any debugger is better than none. The alternative is printing out messages in your code using printf back in the day of straight C, or NSLog these days if you aren’t yet comfortable with using a debugger.
Now, I won’t go into the history, but suffice it to say we used to use GDB, but LLDB is the current course and while the road has been a little bumpy during the transition, things are getting better and debugging is simpler and more powerful than ever. Apple has made it pretty clear that they are trying to give us the tools that enable us to leave the days of placing debug code in our apps behind. I think we’re there. You can now stop on a break point and start analyzing all of your code by using debugger commands and injecting actual Objective-C code that will get evaluated right while you’re running. You can even change the value of your variables on the fly or edit a break point and tell it to print out a variable and then continue running. It’s really quite powerful and your code can remain clean and un-tainted by debug code.
Just A Taste of the Xcode LLDB Tutorial
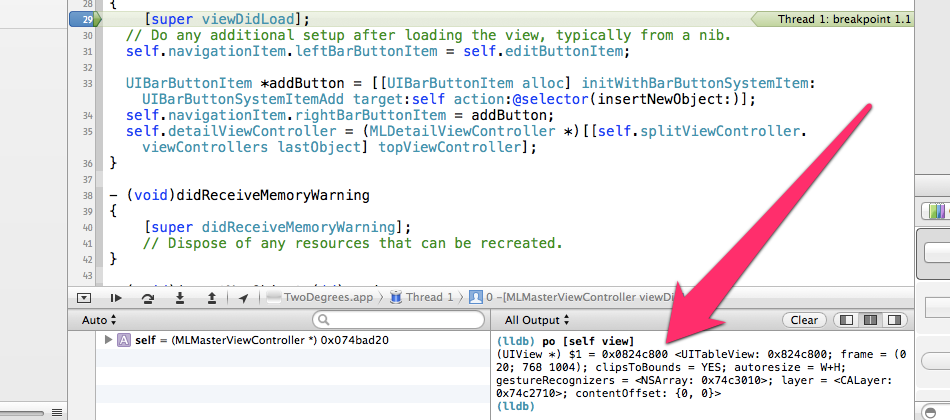
Let’s jump right in with a few basic LLDB commands. The most common commands you’ll use in the debugger are p (for print), for primitive types (booleans, integers, floats, etc.) and po (for print object) for Objective-C objects. When you type po and then then name of an object like the view of your view controller for example:
po [self view]
The debugger will print the description (found in NSObject and overridden by many classes) of that object. In this case it will print something like:
(UIView *) $1 = 0x0824c800 <UITableView: 0x824c800; frame = (0 20; 768 1004); clipsToBounds = YES; autoresize = W+H; gestureRecognizers = <NSArray: 0x74c3010>; layer = <CALayer: 0x74c2710>; contentOffset: {0, 0}>
So how do we get it to do that? Well, the first thing you need to do is set a break point. You do so by clicking in the line numbers on the line where you want to break. For the example above, I set a break point in viewDidLoad: like this:
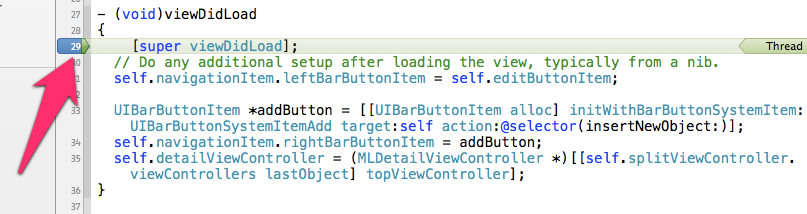
Now run the app and wait for the debugger to break on the break point. Look at the bottom of the Xcode window and you’ll see the console where you enter in your LLDB commands.
A more useful command might be to get the number of subviews contained by our view controller’s view. Since the count of subviews is an integer, a primitive, we should use the p command instead of po. Like this:
p (int)[[[self view] subviews] count]
This will print out:
(int) $2 = 2
Notice we type-casted our return type so the debugger knows what to do with it. Cool, isn’t it? Just wait, it gets better.
Parsing Twitter Feeds
(The code for this section is in the project called TwoDegrees. You can download it at github.)
If you’re a seasoned Twitter API developer, you probably know something about the basic layout of the JSON you receive upon successful timeline request, but even you don’t have the whole thing memorized and will need a way from time to time to look up what the structure is like. Not to mention knowing those folks behind the Twitter API the layout may change from time to time. Wouldn’t it be nice to just spin off your request and then just analyze the response on the fly when you get it back. Watch this.
Here is some Twitter code implemented with iOS6’s Social framework.
- (void)downloadTimeline
{
  ACAccountStore *accountStore = [[ACAccountStore alloc] init];
  ACAccountType *accountType = [accountStore accountTypeWithAccountTypeIdentifier:ACAccountTypeIdentifierTwitter];

  [accountStore requestAccessToAccountsWithType:accountType
                                        options:nil
                                     completion:^(BOOL granted, NSError *error) {
     if (granted) {
       NSArray *accounts = [accountStore accountsWithAccountType:accountType];

       if ([accounts count] > 0) {
         ACAccount *account = [accounts lastObject];

         NSURL *url = [NSURL URLWithString:@"https://api.twitter.com/1.1/statuses/home_timeline.json"];

         NSDictionary *parameters = @{@"count" : @"200"};

         SLRequest *request = [SLRequest requestForServiceType:SLServiceTypeTwitter
                                                 requestMethod:SLRequestMethodGET
                                                           URL:url
                                                    parameters:parameters];

         [request setAccount:account];

         [request performRequestWithHandler:^(NSData *responseData,
                                              NSHTTPURLResponse *urlResponse,
                                              NSError *error) {
           id response = [NSJSONSerialization
                           JSONObjectWithData:responseData
                           options:NSJSONReadingMutableLeaves
                           error:&error];

           DLog(@"Response: %@", response);

            if ([response count] > 0) {
              dispatch_async(dispatch_get_main_queue(), ^{
                // Do something on the main queue
              });
            }
          }];
       }
     } else {
       DLog(@"Failed to get twitter account");
     }
   }];
}
I placed a breakpoint on line 34 where the DLog is. Then I ran this in the console.
po [[response filteredArrayUsingPredicate:(NSPredicate*)[NSPredicate
            predicateWithFormat:@"retweet_count > 0 and retweeted_status.entities.urls.@count > 0"]]
                valueForKeyPath:@"retweeted_status"]
The response object is an array generated by Apple’s JSON parsing class, NSJSONSerialization using the raw data response we got back. This po command is effectively printing out any tweets that have been retweeted that contain at least one URL. So let’s think about that for a second:
“The philosophy behind this query is that if your tweeps retweeted something, it’s probably even more important or interesting to you than it would be otherwise and since it has a URL, the page it links to is probably something you’d be highly interested in reading.”
You can see in our debugger command everything is straight Objective-C code except for the po itself. Here are some important notes about that 1-liner (er, well I had to wrap it so you could see it without scrolling here, however, in my debugger it’s one line).
- When passing a parameter to a method, you have to type-cast that parameter to whatever the method requires. So that’s why we have an
(NSPredicate*)type-cast. - Our predicate contains two parts. The second one uses the @count parameter which evaluates a count of the URLs in the tweet and makes sure there is at least one.
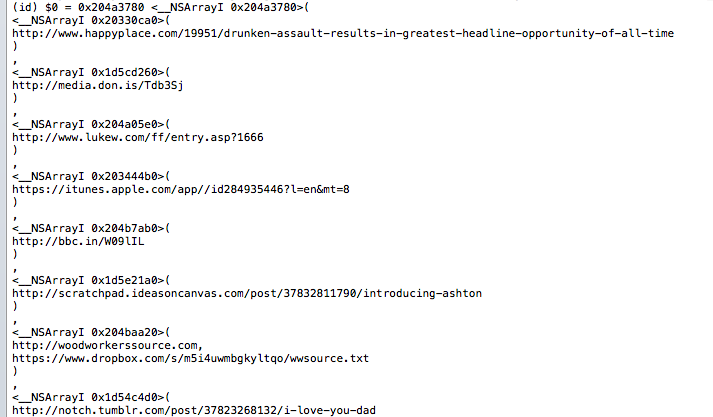
If you’re not familiar with it, KVC, key-value coding, allows us to query our arrays for certain parameters like a count or a sum or we can access a particular property of all of the objects contained within our array. So back in our console, we can dig even deeper. Say that we want to show a list of all of the expanded_urls in those tweets that our tweeps retweeted. We can use some KVC to do it:
po [[response filteredArrayUsingPredicate:
                (NSPredicate*)[NSPredicate predicateWithFormat:@"retweet_count > 0 and
                         retweeted_status.entities.urls.@count > 0"]]
                         valueForKeyPath:@"retweeted_status.entities.urls.expanded_url"]
Note: For those of you who are new to iOS development having come from C#, you’ll notice that KVC has some things in common with Microsoft’s LINQ. They are different, but have some concepts in common that you may be familiar with.
See our call to valueForKeyPath: at the end of our array. Passing it the key path "retweeted_status.entities.urls.expanded_url" is accessing the expanded_url parameter for the list of urls in the entities collection inside each of the retweeted (retweet_count greater than zero) tweets. (Say what? Read it again. It’ll make more sense, I promise.)
Here is what the description for one of the retweeted tweet dictionaries (remember it’s a dictionary now that we parsed the raw JSON) looks like when printed in the console:
{
    contributors = "";
    coordinates = "";
    "created_at" = "Wed Dec 12 19:32:40 +0000 2012";
    entities =     {
        hashtags =         (
        );
        urls =         (
                        {
                "display_url" = "gizmodo.com/5958794/friend\U2026";
                "expanded_url" = "http://gizmodo.com/5958794/friends-dont-let-friends-drink-and-windows-8";
                indices =                 (
                    12,
                    32
                );
                url = "http://t.co/13rMfmAm";
            }
        );
        "user_mentions" =         (
        );
    };
    "retweet_count" = 5;
    retweeted = 0;
    source = "MetroTwit";
    text = "Brilliant.  http://t.co/13rMfmAm";

// Truncated for brevity...
If you realize our response object is actually an array containing a bunch of these dictionaries, you’ll understand that we are filtering that array with a predicate that is looking only for objects with a retweet_count greater than zero. That’s what tells us that it was retweeted. Then, with the valueForKeyPath: we are telling the resulting filtered array to give us all of the expanded_urls for all of those records. That’s pretty cool. Here’s what the output of that po command looks like:
Change The Value of Your Variables On The Fly
(The code for this section is in the project called BogusLogin. You can download it at github. The code is really pointless/useless unless you set the breakpoints I describe below to see how they work. Breakpoints don’t get stored in the project, so you have to set them yourself.)
Let’s push a little farther. How often have you made some changes and restarted the debugger only to realize that the data you wanted is incorrect. Well, just fix it on the fly when you hit a break point using the expr command. Here’s how:
Say you’ve created a login method that authenticates with a server at the press of a login button (our sample code is just a dummy stub with no server connection, btw). If you have to enter those credentials in your app every time you run–tapping away on your device’s glass (and nearly knocking it over if you have a gorilla touch like me), it gets a little tedious and even time consuming. You could use a #ifdef DEBUG macro in your code and specify your debug credentials hard-coded, but why? Use a breakpoint instead. Here is some code with a breakpoint to demonstrate what I mean.
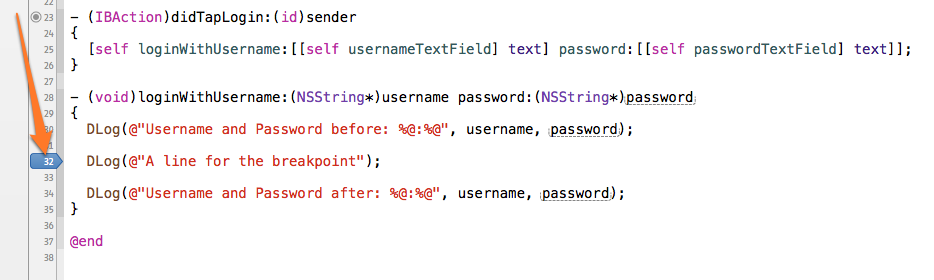
If you run your code and stop on that break point, you can just type:
expr username = @"username"
expr password = @"badpassword"
The console will respond back with:
(NSString *) $0 = 0x3d3504c4 @"username"
(NSString *) $1 = 0x1d18ef60 @"badpassword"
Now, if you let the next two log statements print to the console, you’ll see:
(0x1c59aae0) A line for the breakpoint
(0x1c59aae0) Username and Password after: username:badpassword
But we can go even farther with this. You can edit your breakpoint and have it change the expression automatically and continue on without actually stopping. To do so, right click on the breakpoint and select “Edit Breakpoint…” (or Option-Cmd Click the breakpoint). Then give the breakpoint the settings you see here:
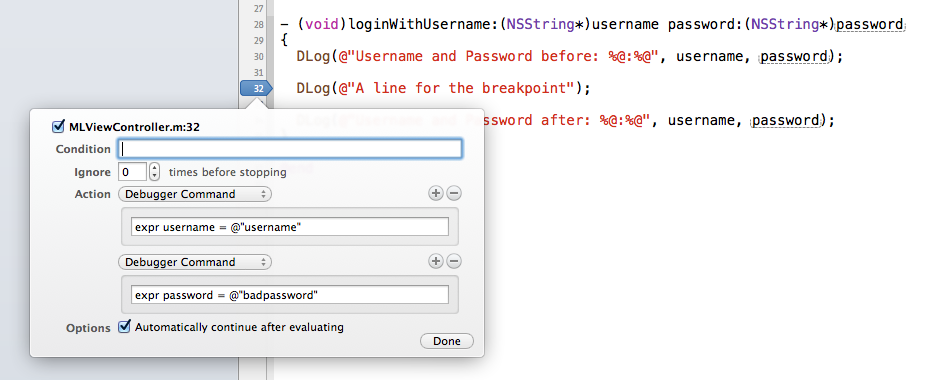
Notice that the checkbox labeled Automatically continue after evaluating is checked. This will ensure that your username and password get changed every time the breakpoint gets hit, but execution will just continue. So, if you have some testing credentials you use while working on your app, just set them in a breakpoint and you’ll never have to actually enter them into your credentials text fields on your login view and you’ll never have to set them in your source either. And the beautiful thing is you didn’t have to have any macros to determine if you were in DEBUG or not. When you ship your app, the breakpoints don’t exist so you will never run the risk of shipping conditional macro code with inverted logic. How awesome is that?
Just to drive the point home, go back into Xcode and click on the breakpoint we set again to disable it. It should now be a light blue color. If you run it again, you’ll see that the username and password no longer get changed.
Conditionals
Finally, one of the greatest powers of using breakpoints is that they allow for conditionals. Say you have a dataset coming back with tens of thousands of records. Say one of the records is corrupted and you know it’s ID, but you want to see what’s going on when that record is being processed/accessed. Place a breakpoint by clicking in the line number column on the line where your data is being processed–likely in some sort of loop. Or I sometimes find I need to see it when I’m trying to render a table cell in the table view delegate method tableView:cellForRowAtIndexPath:. I set the breakpoint there and as soon as that ID matches, I know that the related record is getting displayed. Execution stops and I can start analyzing the data using the other methods we’ve discussed in this post. You set a condition in your breakpoint like this:
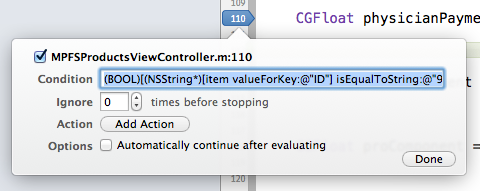
You can’t see the whole condition syntax in that screenshot, so here’s the actual line:
(BOOL)[(NSString*)[item valueForKey:@"ID"] isEqualToString:@"93306"]
As with any commands you give the debugger that contains code you have to typecast everything. In this line we are saying that we only want the breakpoint to stop if our item’s ID field is equal to “93306”. If you do place this breakpoint in tableView:cellForRowAtIndexPath:, you may find that your table view performance suffers, but keep in mind that you only need to keep that breakpoint enabled until you’ve figure out your issue. Then you can either disable it, or remove it.
Note: Sometimes I get overzealous and accidentally remove breakpoints that I may need again later. It’s probably best to just get in the habit of disabling them to keep from accidentally removing them. Obviously it’s not a big deal if they have no conditional logic, but if you’ve spent the time to add a condition, you’ll want to protect that breakpoint so you don’t have to enter it in again. Once you remove the breakpoint, you can’t undo. I suggest you train yourself to disable rather than remove unless you’re absolutely sure you won’t need that breakpoint again.
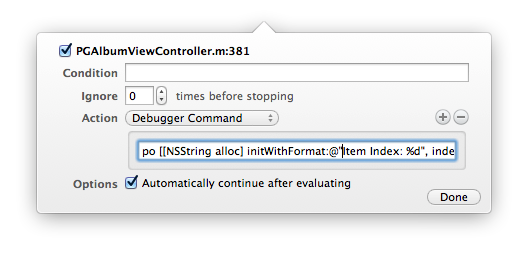
Formatting Strings
If we’re ever to get rid of NSLog, we need a way to get meaningful messages when we’re debugging through some other means. Fortunately, you can just format a string the way you normally would in code when adding a command to a breakpoint, except there’s one gotcha. You may be used to using NSString‘s stringWithFormat: however, this won’t work in the break point. You will instead need to use alloc/init like this:
po [[NSString alloc] initWithFormat:@"Item index is: %d", index]
I don’t know the exact reason at this time, however, when you try to use stringWithFormat:, you get the following error in the console window:
error: too many arguments to method call, expected 1, have 2
error: 1 errors parsing expression
Just use the alloc/init version and it will work fine.
I find this technique very handy and it allows me to avoid using NSLog at all. I realize that DLog is a good substitution for NSLog because it allows you to automatically remove NSLog when you ship a release build, but I’m really starting to like the options that LLDB gives you and you don’t have to add any additional pre-compiler conditional code to your PCH file. Cleaner/less code is always better in my opinion.
Conclusion
Obviously a lot of the LLDB functionality is built into Xcode–things like setting breakpoints by simply clicking on the line number where you want to set it, however, there is a lot of power with the commands that are available to you to execute while running in the debugger. This tutorial has only scratched the surface, but even with the few commands we’ve covered here, you can tell just how much power those few commands give you. If you have any other awesome pro tips for commands that have made your debugging life simpler in Xcode, please share them in the comments. Until next time.
Download the related source code here:
TwoDegrees Xcode Project
BogusLogin Xcode Project
Great article!
I also found very useful to play a sound when hit a break point, is very useful when you just want to know that something happened without block the executions.
I want to share another tips: In the breakpoint navigator if you right click on a breakpoint you have the option to share it, I found it a bless to share breakpoint with my coworker. (it works well with git with .gitignore like this: https://github.com/github/gitignore/blob/master/Objective-C.gitignore)
[…] Matt Long goes into great detail on how to use the Xcode LLDB to solve bugs. If you work in Xcode, this is a must-read. […]
That’s a pretty cool trick setting up the login information in a breakpoint.
One simplification– when typecasting return types in LLDB, if the return type inherits from NSObject, you can just use “id”. It doesn’t actually matter if you get the class right, since LLDB isn’t consulting the header file anyway. So instead of typecasting to “(NSPredicate *)”, just use “(id)”.